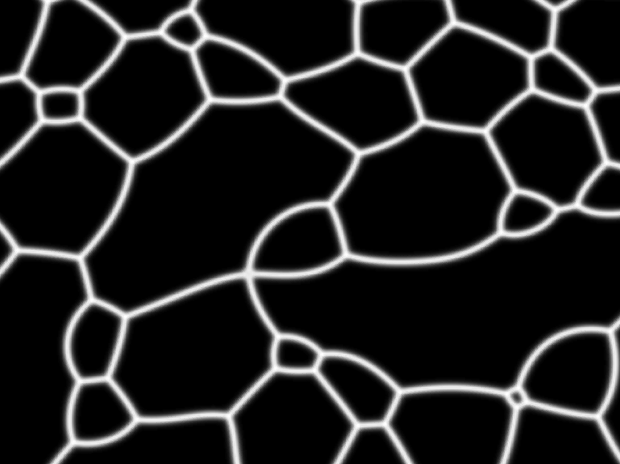
Phase-field code to generate the microstructure showing grain growth in a metallic system. Implemented using MATLAB.

Variable mobility Cahn-Hilliard equation with order-parameter dependent mobility. Implemented using C language. Microstructure generated by converting simulation binary data into a PS file.
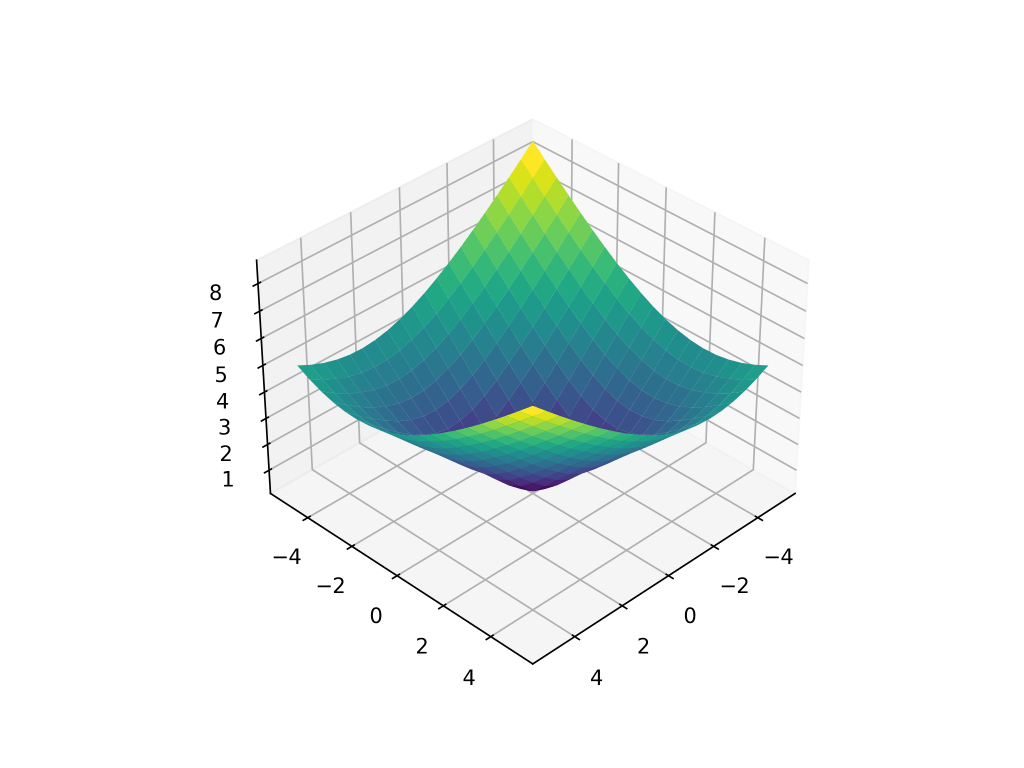
3D surface plot of a multivariate function with Viridis colormap. Plotted using plot_surface() function of PyPlot Module of Matplotlib package. Script available for download at the Python data visualization repository (link provided below).

GIF animation of sine waves in 3D space using Mayavi scientific data visualization package. The animation generated using MoviePy package. Script available for download in the Python data visualization repository (link provided below).
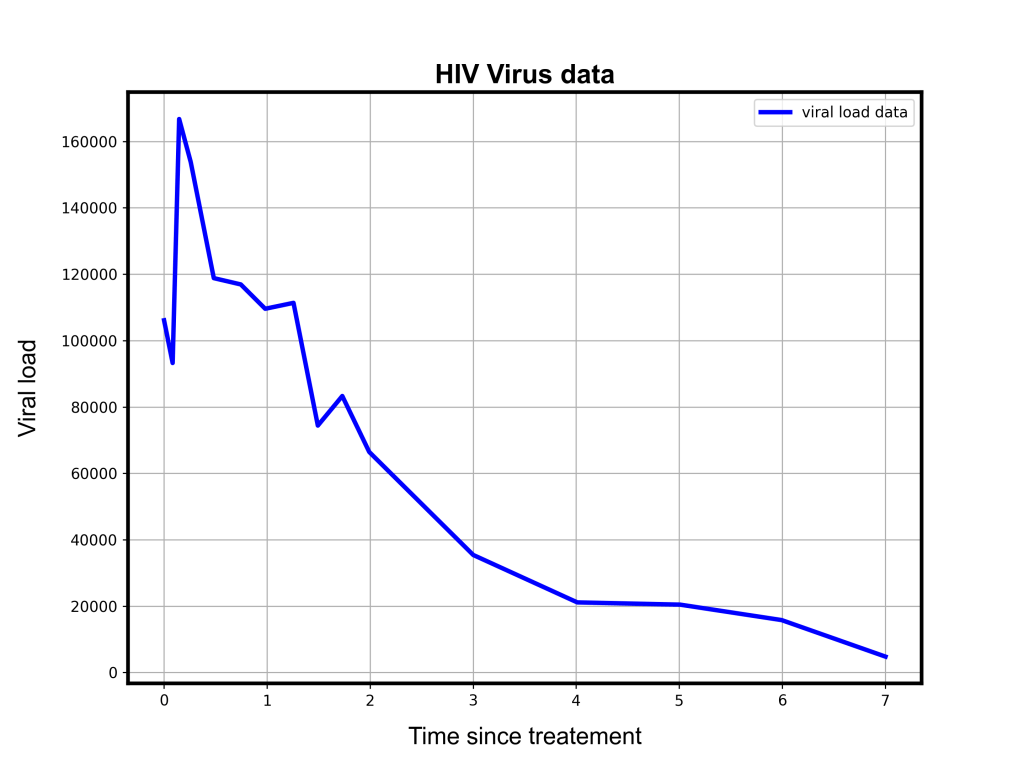
The HIV viral load data visualization using PyPlot module of Matplotlib package. Script available for download in the Python data visualization repository (link provided below).
